FADA adds Construction Equipment as new category for deeper insights
The Federation of Automobile Dealers Associations (FADA) has released vehicle retail data for May 2025, reporting an overall year-on-year (YoY) growth of 5%. To enhance the granularity of industry insights, FADA has announced the introduction of a new standalone category for Construction Equipment (CE), which will no longer be grouped under Commercial Vehicles (CV). This strategic shift acknowledges CE’s distinct market behaviour and its critical role in driving infrastructure development.

May’25 Retail Highlights
Commenting on the monthly performance, C S Vigneshwar, President of FADA, stated: “May registered a modest 5% YoY growth, led by positive momentum in the 2W, 3W and tractor segments, which grew by 7.3%, 6.2% and 2.7% respectively. In contrast, PV, CE and CV segments declined by 3.1%, 6.3% and 3.7% respectively.”
The 2W segment demonstrated resilience, with retail volumes increasing 7.31% YoY despite a 2.02% MoM dip. Strong demand in semi-urban and rural areas—fuelled by auspicious marriage dates, a healthy Rabi harvest, and pre-monsoon buying—was partially offset by persistent financing constraints in the entry-level segment.
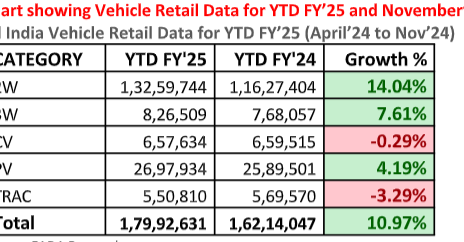
Chart showing Vehicle Retail Data for May’25
All India Vehicle Retail Data for YTD FY’25 (Apr’25 to May’25)
| CATEGORY | YTD FY’25 | YTD FY’24 | Growth % |
| 2W | 33,46,427 | 31,89,683 | 4.91% |
| 3W | 2,04,232 | 1,78,400 | 14.48% |
| CV | 1,61,265 | 1,64,117 | -1.74% |
| CE | 12,401 | 13,456 | -7.84% |
| PV | 6,63,390 | 6,56,511 | 1.05% |
| TRAC | 1,32,946 | 1,26,692 | 4.94% |
| Total | 45,20,661 | 43,28,859 | 4.43% |
Passenger vehicle (PV) sales fell 13.6% MoM and 3.1% YoY, driven by declining retail conversions, particularly in entry-level models. Inventory days climbed to 52–53, up from ~50, signalling concerns around overstocking. “Border-state tensions in regions like Jammu & Kashmir, Punjab, Rajasthan, and Gujarat, combined with tight financing and subdued sentiment, led to delayed purchase decisions. While bookings remained healthy, retail conversions suffered,” Mr. Vigneshwar noted.
All India Vehicle Retail Data for May’25
| CATEGORY | May’25 | Apr’25 | May’24 | MoM% | YoY% |
| 2W | 16,52,637 | 16,86,774 | 15,40,077 | -2.02% | 7.31% |
| 3W | 1,04,448 | 99,766 | 98,274 | 4.69% | 6.28% |
| E-RICKSHAW(P) | 40,635 | 39,528 | 39,500 | 2.80% | 2.87% |
| E-RICKSHAW WITH CART (G) | 7,972 | 7,463 | 5,533 | 6.82% | 44.08% |
| THREE-WHEELER (GOODS) | 10,272 | 10,312 | 9,933 | -0.39% | 3.41% |
| THREE-WHEELER (PASSENGER) | 45,429 | 42,321 | 43,230 | 7.34% | 5.09% |
| THREE-WHEELER (PERSONAL) | 140 | 142 | 78 | -1.41% | 79.49% |
| PV | 3,02,214 | 3,49,939 | 3,11,908 | -13.64% | -3.11% |
| TRAC | 71,992 | 60,915 | 70,063 | 18.18% | 2.75% |
| CE | 5,903 | 6,405 | 6,301 | -7.84% | -6.32% |
| CV | 75,615 | 85,203 | 78,530 | -11.25% | -3.71% |
| LCV | 44,419 | 46,721 | 45,870 | -4.93% | -3.16% |
| MCV | 6,772 | 7,089 | 6,359 | -4.47% | 6.49% |
| HCV | 24,382 | 31,330 | 26,234 | -22.18% | -7.06% |
| Others | 42 | 63 | 67 | -33.33% | -37.31% |
| Total | 22,12,809 | 22,89,002 | 21,05,153 | -3.33% | 5.11% |
Source: FADA Research
In the commercial vehicle (CV) space, retail sales dropped 11.25% MoM and 3.71% YoY. A sluggish freight cycle, constrained liquidity, and cautious lending created downward pressure across sub-segments, including trucks and passenger carriers. Bus sales offered marginal support. Meanwhile, OEMs and dealers increased dispatches ahead of the upcoming June 2025 deadline for mandatory air-conditioned driver cabins.
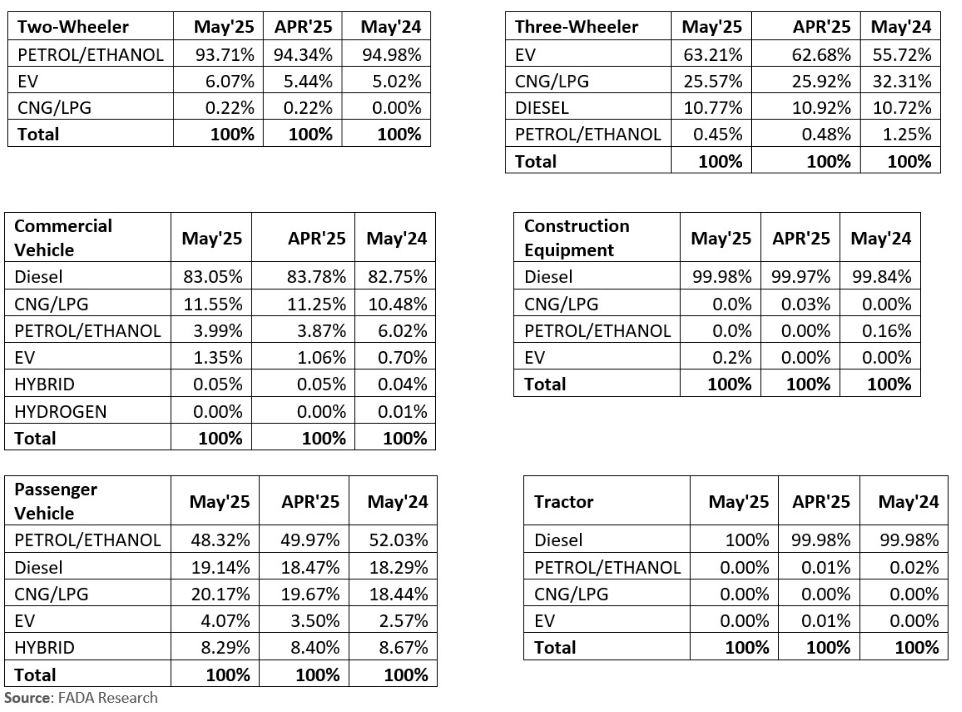
Chart showing Fuel Wise Vehicle Retail Market Share for May’25
Near-Term Outlook: June ’25
India’s economic fundamentals remain sound, with Q4 FY25 GDP growth holding at ~6.5% and inflation trending toward the Reserve Bank of India’s 4% target. The Indian Meteorological Department’s revised monsoon forecast (106% of long-period average) is expected to bolster rural incomes, enhancing demand for 2Ws and tractors.
In anticipation of a likely 25 basis-point rate cut by the RBI in early June, borrowing conditions are expected to improve for both customers and dealerships. Recent policy measures—such as the 3% MSP hike for kharif crops—could further unlock rural liquidity.
However, global supply-chain risks, including rare-earth material shortages and geopolitical uncertainties, may continue to dampen urban consumer sentiment.
According to FADA’s internal survey, 55.46% of members expect flat demand in June, 31% foresee growth, and 13.54% anticipate a decline—indicating a cautiously optimistic industry sentiment.
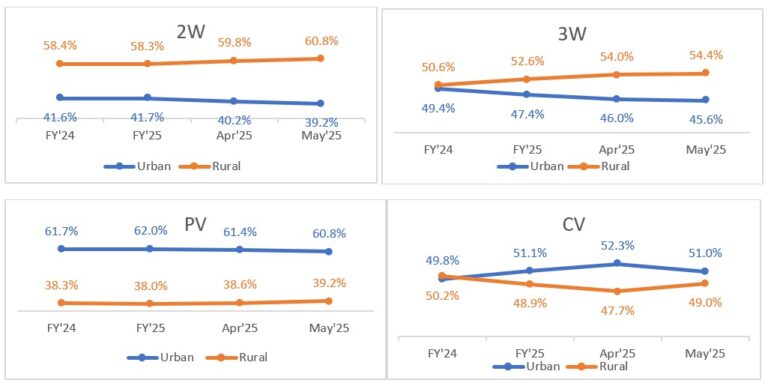
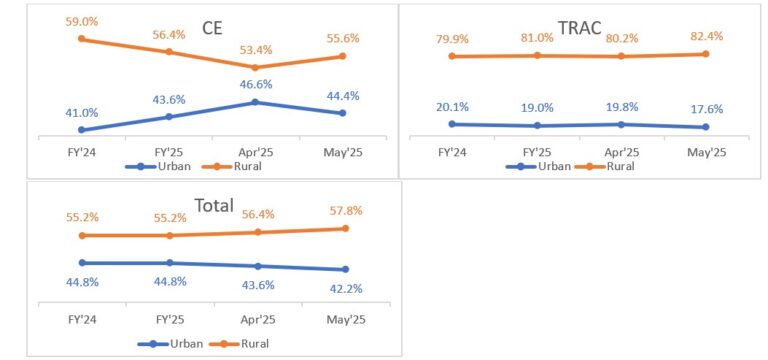
All India Vehicle Retail Strength Index for May’25 on basis of Urban & Rural RTOs.
Channel-Wise Perspective
- 2W segment: Will likely benefit from rural cash flows and Rath Yatra-related festive buying. However, financing constraints and selective OEM price increases may limit growth.
- PV segment: Dealers are grappling with high inventory levels and ageing product portfolios. While some micro-markets may see an uptick, conversions are expected to remain slow.
- CV segment: Inventory churn driven by the regulatory transition is expected to persist. Freight movement in key sectors like cement, coal, and mining remains tepid due to weak demand and liquidity challenges.
Vigneshwar concluded: “Navigating June will require calibrated production planning, targeted channel incentives, and robust working capital support. With these measures in place, the industry can weather current headwinds and prepare for the next leg of demand recovery.”
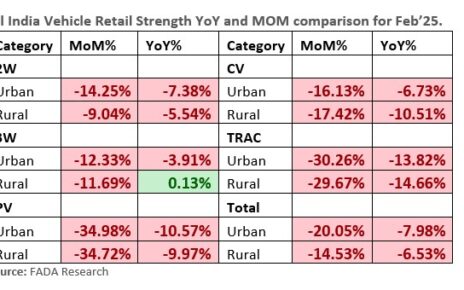
All India Vehicle Retail Strength YoY and MOM comparison for May’25.
OEM wise Market Share Data for May’25 (YoY comparison)
| Two-Wheeler OEM | May’25 | Market Share (%) May’25 | May’24 | Market Share (%) May’24 |
| HERO MOTOCORP LTD | 4,99,036 | 30.20% | 4,46,404 | 28.99% |
| HONDA MOTORCYCLE AND SCOOTER INDIA (P) LTD | 3,93,383 | 23.80% | 3,92,030 | 25.46% |
| TVS MOTOR COMPANY LTD | 3,09,285 | 18.71% | 2,63,977 | 17.14% |
| BAJAJ AUTO GROUP | 1,84,831 | 11.18% | 1,75,535 | 11.40% |
| BAJAJ AUTO LTD | 1,84,831 | 11.18% | 1,75,535 | 11.40% |
| CHETAK TECHNOLOGY LIMITED | – | 0.00% | – | 0.00% |
| SUZUKI MOTORCYCLE INDIA PVT LTD | 87,519 | 5.30% | 82,292 | 5.34% |
| ROYAL-ENFIELD (UNIT OF EICHER LTD) | 76,608 | 4.64% | 64,577 | 4.19% |
| INDIA YAMAHA MOTOR PVT LTD | 50,388 | 3.05% | 54,679 | 3.55% |
| OLA ELECTRIC TECHNOLOGIES PVT LTD | 18,501 | 1.12% | 37,389 | 2.43% |
| ATHER ENERGY LTD | 12,856 | 0.78% | 6,154 | 0.40% |
| GREAVES ELECTRIC MOBILITY PVT LTD | 4,178 | 0.25% | 1,958 | 0.13% |
| PIAGGIO VEHICLES PVT LTD | 2,355 | 0.14% | 3,087 | 0.20% |
| CLASSIC LEGENDS PVT LTD | 1,965 | 0.12% | 2,506 | 0.16% |
| Others Including EV | 11,732 | 0.71% | 9,489 | 0.62% |
| Total | 16,52,637 | 100% | 15,40,077 | 100% |
Source: FADA Research
| Three-Wheeler OEM | May’25 | Market Share (%) May’25 | May’24 | Market Share (%) May’24 |
| BAJAJ AUTO LTD | 34,597 | 33.12% | 35,529 | 36.15% |
| MAHINDRA & MAHINDRA LIMITED | 7,203 | 6.90% | 5,287 | 5.38% |
| MAHINDRA LAST MILE MOBILITY LTD | 7,176 | 6.87% | 5,151 | 5.24% |
| MAHINDRA & MAHINDRA LIMITED | 27 | 0.03% | 136 | 0.14% |
| PIAGGIO VEHICLES PVT LTD | 6,218 | 5.95% | 7,017 | 7.14% |
| YC ELECTRIC VEHICLE | 3,684 | 3.53% | 3,779 | 3.85% |
| TVS MOTOR COMPANY LTD | 3,451 | 3.30% | 1,717 | 1.75% |
| ATUL AUTO LTD | 2,045 | 1.96% | 2,450 | 2.49% |
| SAERA ELECTRIC AUTO PVT LTD | 2,004 | 1.92% | 2,473 | 2.52% |
| DILLI ELECTRIC AUTO PVT LTD | 1,734 | 1.66% | 2,206 | 2.24% |
| MINI METRO EV L.L.P | 1,190 | 1.14% | 1,318 | 1.34% |
| UNIQUE INTERNATIONAL | 1,143 | 1.09% | 1,324 | 1.35% |
| ENERGY ELECTRIC VEHICLES | 1,142 | 1.09% | 1,068 | 1.09% |
| SAHNIANAND E VEHICLES PVT LTD | 1,114 | 1.07% | 805 | 0.82% |
| Others including EV | 38,923 | 37.27% | 33,301 | 33.89% |
| Total | 1,04,448 | 100% | 98,274 | 100% |
Source: FADA Research
| Commercial Vehicle OEM | May’25 | Market Share (%) May’25 | May’24 | Market Share (%) May’24 |
| TATA MOTORS LTD | 26,100 | 34.52% | 29,512 | 37.58% |
| MAHINDRA & MAHINDRA LIMITED | 19,816 | 26.21% | 19,826 | 25.25% |
| MAHINDRA & MAHINDRA LIMITED | 18,343 | 24.26% | 18,454 | 23.50% |
| MAHINDRA LAST MILE MOBILITY LTD | 1,473 | 1.95% | 1,372 | 1.75% |
| ASHOK LEYLAND LTD | 13,763 | 18.20% | 13,635 | 17.36% |
| ASHOK LEYLAND LTD | 13,638 | 18.04% | 13,607 | 17.33% |
| SWITCH MOBILITY AUTOMOTIVE LTD | 125 | 0.17% | 28 | 0.04% |
| VE COMMERCIAL VEHICLES LTD | 6,734 | 8.91% | 6,597 | 8.40% |
| MARUTI SUZUKI INDIA LTD | 3,122 | 4.13% | 3,357 | 4.27% |
| FORCE MOTORS LIMITED | 2,088 | 2.76% | 1,643 | 2.09% |
| DAIMLER INDIA COMMERCIAL VEHICLES PVT. LTD | 1,825 | 2.41% | 1,840 | 2.34% |
| SML ISUZU LTD | 1,509 | 2.00% | 1,467 | 1.87% |
| Others | 658 | 0.87% | 653 | 0.83% |
| Total | 75,615 | 100.00% | 78,530 | 100.00% |
Source – FADA Research
| Construction Equipment OEM | May’25 | Market Share (%) May’25 | May’24 | Market Share (%) May’24 |
| JCB INDIA LIMITED | 2,395 | 40.57% | 2,890 | 45.87% |
| ACTION CONSTRUCTION EQUIPMENT LTD. | 685 | 11.60% | 751 | 11.92% |
| AJAX ENGINEERING LTD | 461 | 7.81% | 438 | 6.95% |
| ESCORTS KUBOTA LIMITED (CONSTRUCTION EQUIPMENT) | 372 | 6.30% | 503 | 7.98% |
| CASE NEW HOLLAND CONSTRUCTION EQUIPMENT(I) PVT LTD | 178 | 3.02% | 147 | 2.33% |
| TATA HITACHI CONSTRUCTION MACHINERY COMP. PVT LTD | 164 | 2.78% | 98 | 1.56% |
| CATERPILLAR INDIA PRIVATE LIMITED | 159 | 2.69% | 153 | 2.43% |
| LIUGONG INDIA PVT. LTD | 141 | 2.39% | 89 | 1.41% |
| BULL MACHINES PVT LTD | 131 | 2.22% | 107 | 1.70% |
| MAHINDRA & MAHINDRA LIMITED | 129 | 2.19% | 106 | 1.68% |
| M/S SCHWING STETTER (INDIA) PRIVATE LIMITED | 109 | 1.85% | 113 | 1.79% |
| ALL TERRAIN CRANE | 103 | 1.74% | 72 | 1.14% |
| INDO FARM EQUIPMENT LIMITED | 93 | 1.58% | 69 | 1.10% |
| DOOSAN BOBCAT INDIA PVT LTD | 62 | 1.05% | 52 | 0.83% |
| VOLVO CE INDIA PRIVATE LIMITED | 62 | 1.05% | 43 | 0.68% |
| Others | 659 | 11.16% | 670 | 10.63% |
| Total | 5,903 | 100.00% | 6,301 | 100.00% |
Source: FADA Research
| PV OEM | May’25 | Market Share (%) May’25 | May’24 | Market Share (%) May’24 |
| MARUTI SUZUKI INDIA LTD | 1,16,899 | 38.68% | 1,23,295 | 39.53% |
| MAHINDRA & MAHINDRA LIMITED | 43,560 | 14.41% | 34,517 | 11.07% |
| HYUNDAI MOTOR INDIA LTD | 38,189 | 12.64% | 45,503 | 14.59% |
| TATA MOTORS LTD | 36,669 | 12.13% | 42,332 | 13.57% |
| TOYOTA KIRLOSKAR MOTOR PVT LTD | 22,031 | 7.29% | 19,344 | 6.20% |
| KIA INDIA PRIVATE LIMITED | 16,810 | 5.56% | 19,394 | 6.22% |
| SKODA AUTO VOLKSWAGEN GROUP | 8,359 | 2.77% | 6,577 | 2.11% |
| SKODA AUTO VOLKSWAGEN INDIA PVT LTD | 8,328 | 2.76% | 6,527 | 2.09% |
| VOLKSWAGEN AG/INDIA PVT. LTD. | 13 | 0.00% | 2 | 0.00% |
| AUDI AG | 18 | 0.01% | 43 | 0.01% |
| SKODA AUTO INDIA/AS PVT LTD | – | 0.00% | 5 | 0.00% |
| JSW MG MOTOR INDIA PVT LTD | 4,982 | 1.65% | 4,474 | 1.43% |
| HONDA CARS INDIA LTD | 4,076 | 1.35% | 4,908 | 1.57% |
| RENAULT INDIA PVT LTD | 2,434 | 0.81% | 3,667 | 1.18% |
| NISSAN MOTOR INDIA PVT LTD | 1,529 | 0.51% | 2,079 | 0.67% |
| MERCEDES -BENZ GROUP | 1,335 | 0.44% | 1,256 | 0.40% |
| MERCEDES-BENZ INDIA PVT LTD | 1,244 | 0.41% | 1,142 | 0.37% |
| MERCEDES -BENZ AG | 80 | 0.03% | 109 | 0.03% |
| DAIMLER AG | 11 | 0.00% | 5 | 0.00% |
| BMW INDIA PVT LTD | 1,045 | 0.35% | 1,029 | 0.33% |
| FORCE MOTORS LIMITED | 602 | 0.20% | 735 | 0.24% |
| BYD INDIA PRIVATE LIMITED | 494 | 0.16% | 177 | 0.06% |
| PCA AUTOMOBILES INDIA PVT LTD | 398 | 0.13% | 448 | 0.14% |
| JAGUAR LAND ROVER INDIA LIMITED | 373 | 0.12% | 362 | 0.12% |
| FCA INDIA AUTOMOBILES PRIVATE LIMITED | 270 | 0.09% | 368 | 0.12% |
| Others | 2,159 | 0.71% | 1,443 | 0.46% |
| Total | 3,02,214 | 100% | 3,11,908 | 100% |
Source: FADA Research
| Tractor OEM | May’25 | Market Share (%) May’25 | May’24 | Market Share (%) May’24 |
| MAHINDRA & MAHINDRA LIMITED (TRACTOR) | 16,511 | 22.93% | 15,921 | 22.72% |
| MAHINDRA & MAHINDRA LIMITED (SWARAJ DIVISION) | 13,643 | 18.95% | 13,101 | 18.70% |
| INTERNATIONAL TRACTORS LIMITED | 9,620 | 13.36% | 9,228 | 13.17% |
| ESCORTS KUBOTA LIMITED (AGRI MACHINERY GROUP) | 8,161 | 11.34% | 7,656 | 10.93% |
| TAFE LIMITED | 7,502 | 10.42% | 8,516 | 12.15% |
| JOHN DEERE INDIA PVT LTD (TRACTOR DEVISION) | 5,924 | 8.23% | 5,130 | 7.32% |
| EICHER TRACTORS | 4,311 | 5.99% | 4,465 | 6.37% |
| CNH INDUSTRIAL (INDIA) PVT LTD | 3,051 | 4.24% | 2,897 | 4.13% |
| KUBOTA AGRICULTURAL MACHINERY INDIA PVT.LTD. | 797 | 1.11% | 1,157 | 1.65% |
| Others | 2,472 | 3.43% | 1,992 | 2.84% |
| Total | 71,992 | 100% | 70,063 | 100% |